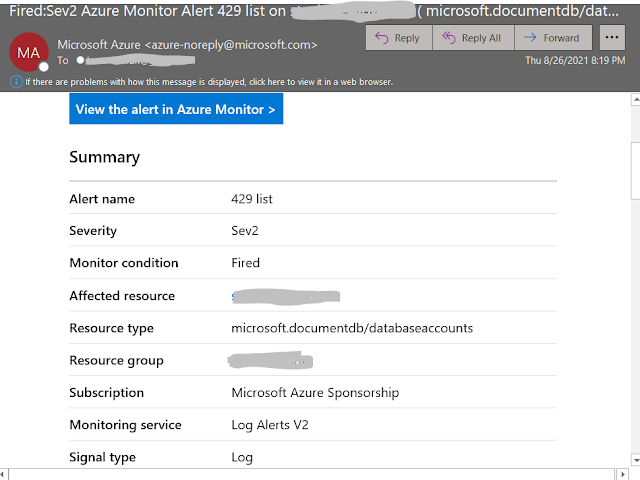
Developers like to know when things go wrong in applications. It is an easy and simple solution to send an email when a bad error occurs. Things can go wrong easily in Cosmos Db, one of the most common error you will get from Cosmos DB is "Request rate too large (429)" exception. This error says that you do not have enough request units to run a query. This error usually occurs in peak times. Usually cause of getting 429 errors is the configuration of Request Units settings. You need to scale up your application or optimize your queries.
It takes more time to retrieve data from Cosmos DB when error 429 occurs. You should get notification when this occurs, but you do not want to get an email each time it occurs either. 1- 5% of requests with 429 is acceptable. You can always open the Cosmos DB Monitoring tools and keep eye on it, or you can create Cosmos DB Alerts to get emails.
I will show you step by step how to configure Alerts that sends email / SMS / Voicemail for 429 errors. You can use the same process to create other alerts too. First step is to click on Diagnostics settings.
You need to give a name to this diagnostic setting and select what type of logs you like to query under the Category details. Also, you need to select a destination for selected category details. I want to send selected category details to Log Analytics workspace in this example.
Click Save and you should get success message. If this is your first diagnostic setting, you may need to wait 5 to 10 minutes for Azure to make the logs available so you can query them. Next, we need to open to Azure Cosmos DB logs. Click on logs in the right side and pick Collections with throttles (429)
When Logs page opens, it throws following error. I do not think that error should be there but let's continue, we will make it work :)
We will use Kusto language to query log analytics to find all 429 errors. Azure Kusto language looks like T-SQL syntax with python like functions to add all type of charts and groupings. You can learn more about Kusto language from here.
I will use the following query to find 429 errors in last hour. You can change this query or write totally different query to get whatever you are looking for.
    AzureDiagnostics
| where TimeGenerated >= ago(1hr)
| where Category == "DataPlaneRequests"
| where statusCode_s == 429
| summarize numberOfThrottles = count()
    by databaseName_s,
    collectionName_s,
    requestResourceType_s,
    _ResourceId,
    bin(TimeGenerated, 1hr)
| order by numberOfThrottles
It looks like I generated couple of 429 errors. Request Unit Consumption hits to 100% and Cosmos DB starts to throw 429 errors. My Kusto query should return something now for sure.
We are ready to create an alert which will run this query and notice us in some way if it is necessary. To do that, click on new alert rule link.
You should see the following page after you click on new alert rule link. Top part has the query we can run to find 429 Errors. We will use Measurement section to define measure aggregation then we will use Alert Logic section to define a threshold. Azure will notify us when threshold logic matches to values.
Here is my measurement section. I want to watch the numberofThrottles property of the query. I care the total number of errors and I want to check last 2 hours for this measurement.
Next is the Alert Logic section, I want to be notified when there are more than five 429 errors. I want Azure to evaluate this logic every 5 minutes by selecting the following options.
Now, we need to define what needs to happen when this alert gets triggered. Click on Actions tab, if you are using Azure Resource Models, you can check the Application Insights smart Detection check box. I want to send an email to a custom email, so I need to create a new action group by clicking Create Action group.
New window will open when you click this option. Just give a name to this group and click on Notifications.
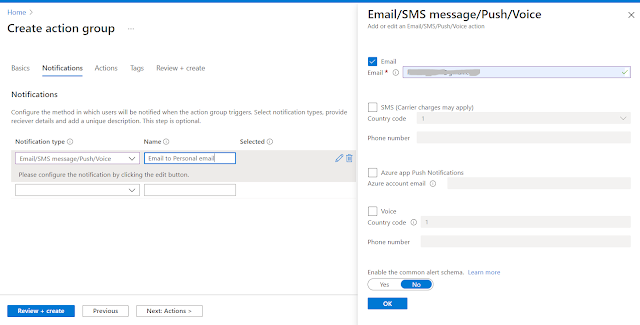
You can use the Notification tab to define how this error should be send to receiver. I want to receive an email, so I checked the email checkbox and type my email address.
Last section we need to fill is the Alert Rule Details. We need to give a name, severity, and description to this rule for the dashboard use.


This comment has been removed by a blog administrator.
ReplyDelete